In February, Samantha, Adria and I traded in our Syracuse winter coats for Long Beach sunglasses. We touched down in Long Beach, California and geared up for a three-day workshop on designing human-centered solutions to complex social challenges, like economic opportunity.

Long Beach, Minneapolis, Jerusalem and Syracuse i-teams with our Bloomberg design coaches.
When researching any subject matter, I’ve always gravitated to the numbers. For me, quantitative data are easier to comprehend - they’re defined and measurable, they fit into a neat, excel format and, if analyzed carefully, can be condensed down into key, illuminating numbers. For example:
24.1% of people living in Syracuse have moved since the previous year (ACS 2015 1-year).
14.51% of properties in the City of Syracuse have at least one open code violation (City of Syracuse - Division of Code Enforcement records February 2017).
Next to quantitative data, qualitative data can seem… messy. Qualitative data often uses personal interactions, observations, and interviews to gather focused and in-depth descriptions of an individual’s experience. For example:
A Syracuse tenant initially tried reaching out to her landlord regarding open code violations in her apartment. Despite many efforts, her landlord could not be reached so eventually, the tenant was forced to move. She did not know that she could call the City for help with the code violations in her home (Observations from a tenant scheduled code inspection - October 2016).
The City of Syracuse gives landlords 24 hours to remedy certain violations, however, because notifications are sent via mail, landlords often receive the notification after the 24 hours are up (Interview with a Syracuse landlord - December 2016).
Qualitative data points are a necessary component in our i-team’s research. They offer insight into human behaviors and routines. They push back against the standardization of quantitative data and remind us that the human experience is complex and varied. Perhaps most importantly, they give value and voice to our subject matter, reminding us that our analysis involves looking at people’s daily lives.
Over the past six months, our office has conducted over 140 interviews and observations – each adding to our understanding of Syracuse’s economic opportunity challenges. The dilemma associated with conducting so many interviews becomes organizing and analyzing large amounts of qualitative data - data that asks not to be standardized or generalized. So when Bloomberg asked us to bring along a sampling of our qualitative data, we showed up excited and ready to learn as much as we could.
Our wonderful moderators, Lauren and Andre from Appropriate Design and Stephanie from the Bloomberg i-teams program, spent the first day introducing us to Design-Based Innovation. They provided examples of successful and effective solutions to complex human-centered problems through disciplined analysis of qualitative data.
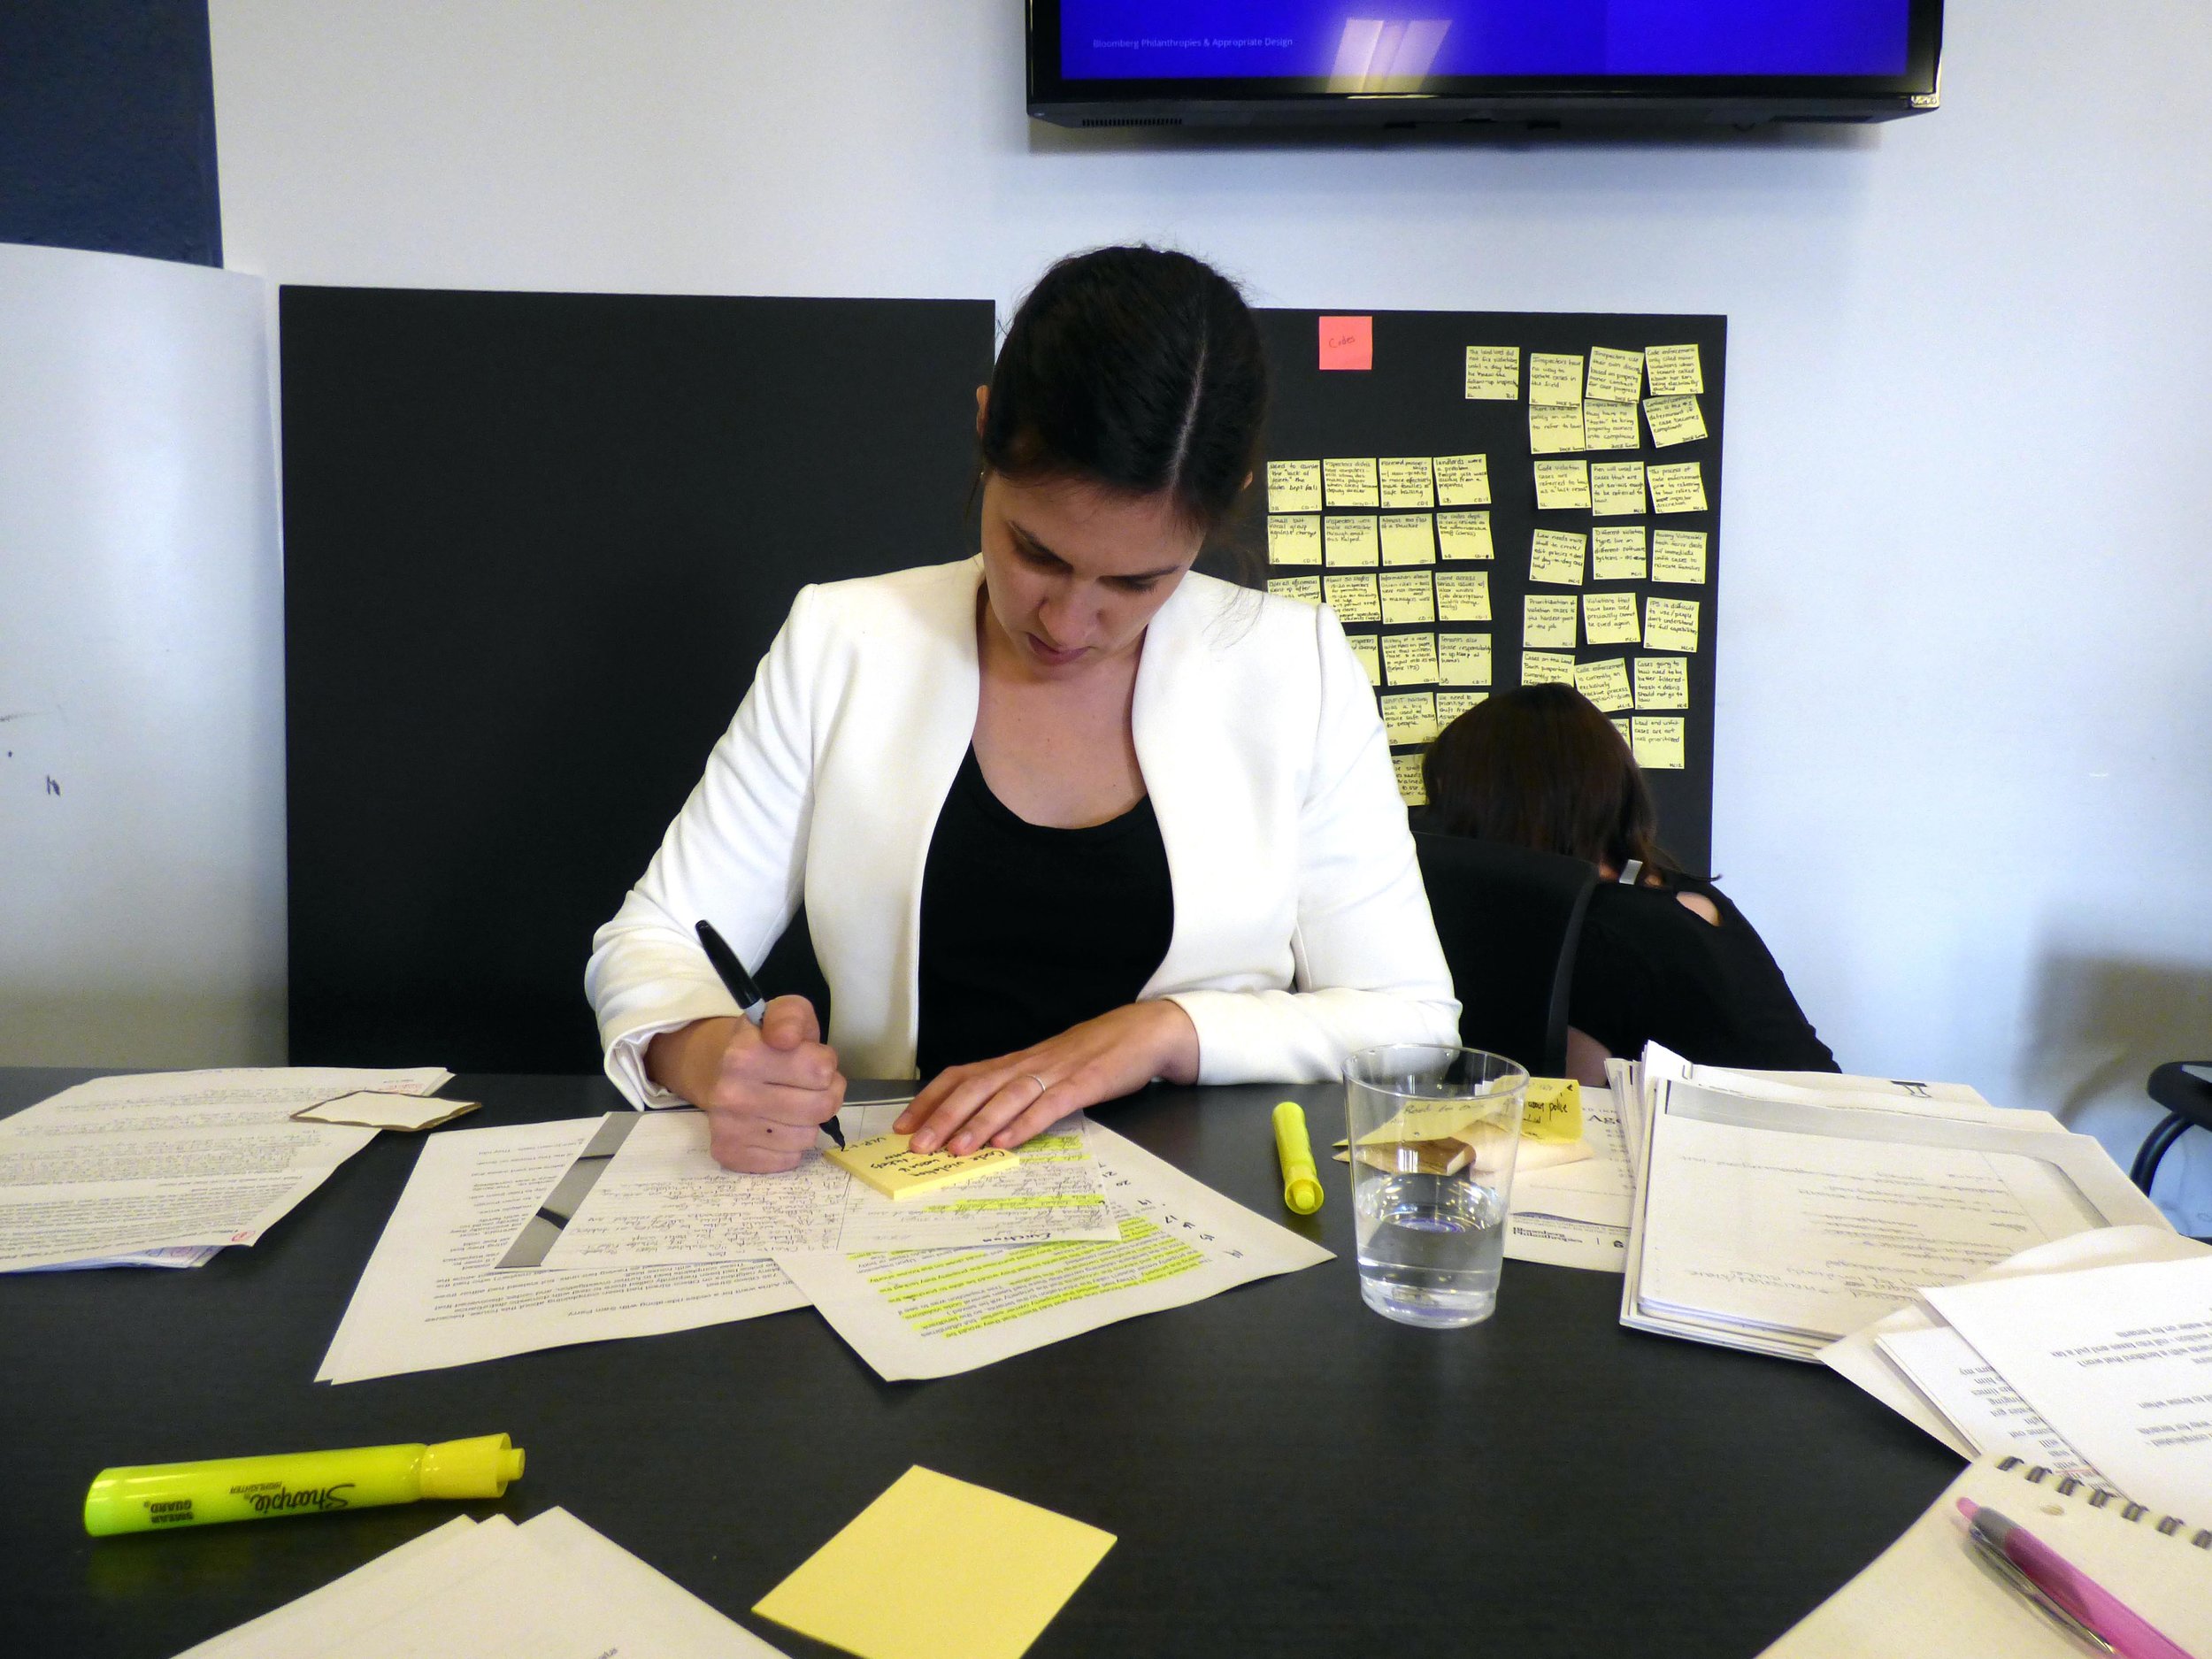
Adria and Susannah creating research insights with Stephanie Wade, Bloomberg Philanthropies.
We were introduced to several methods that each aimed to focus the team on actionable themes and data points. The main methods practiced included design pillar development, customer journey mapping and insight combinations. Each involved a process that broke down biases and organized understanding.
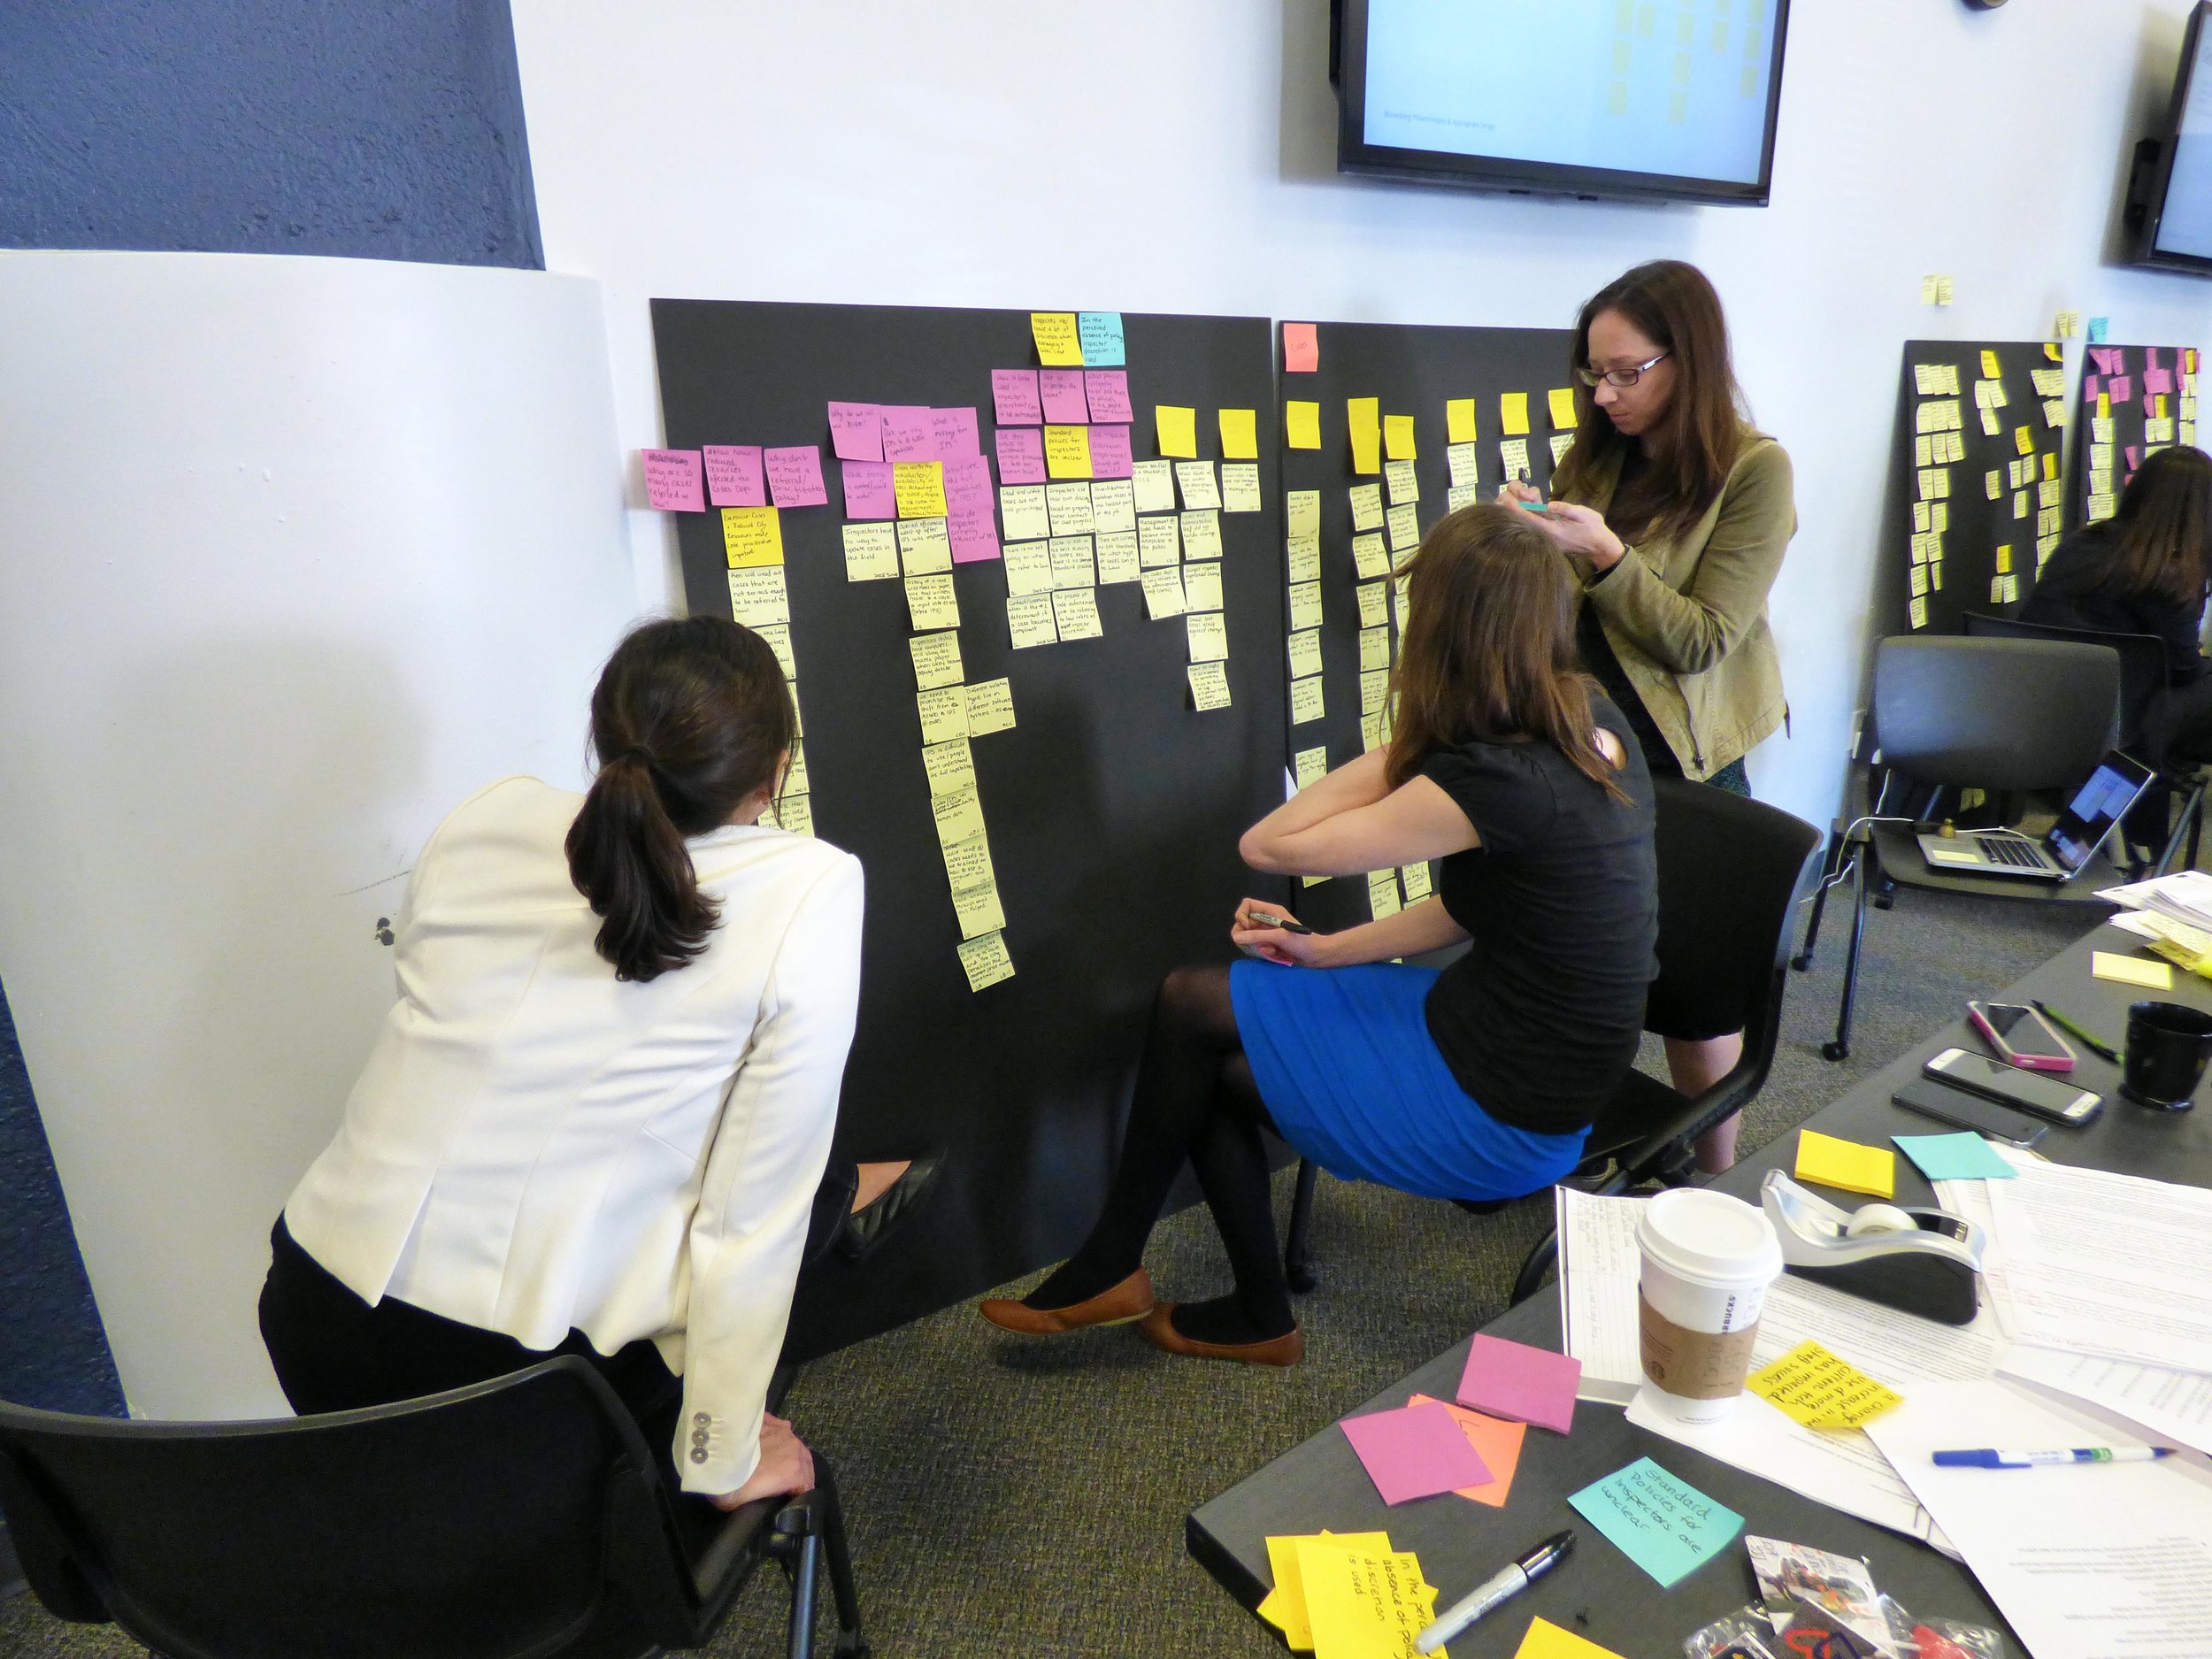
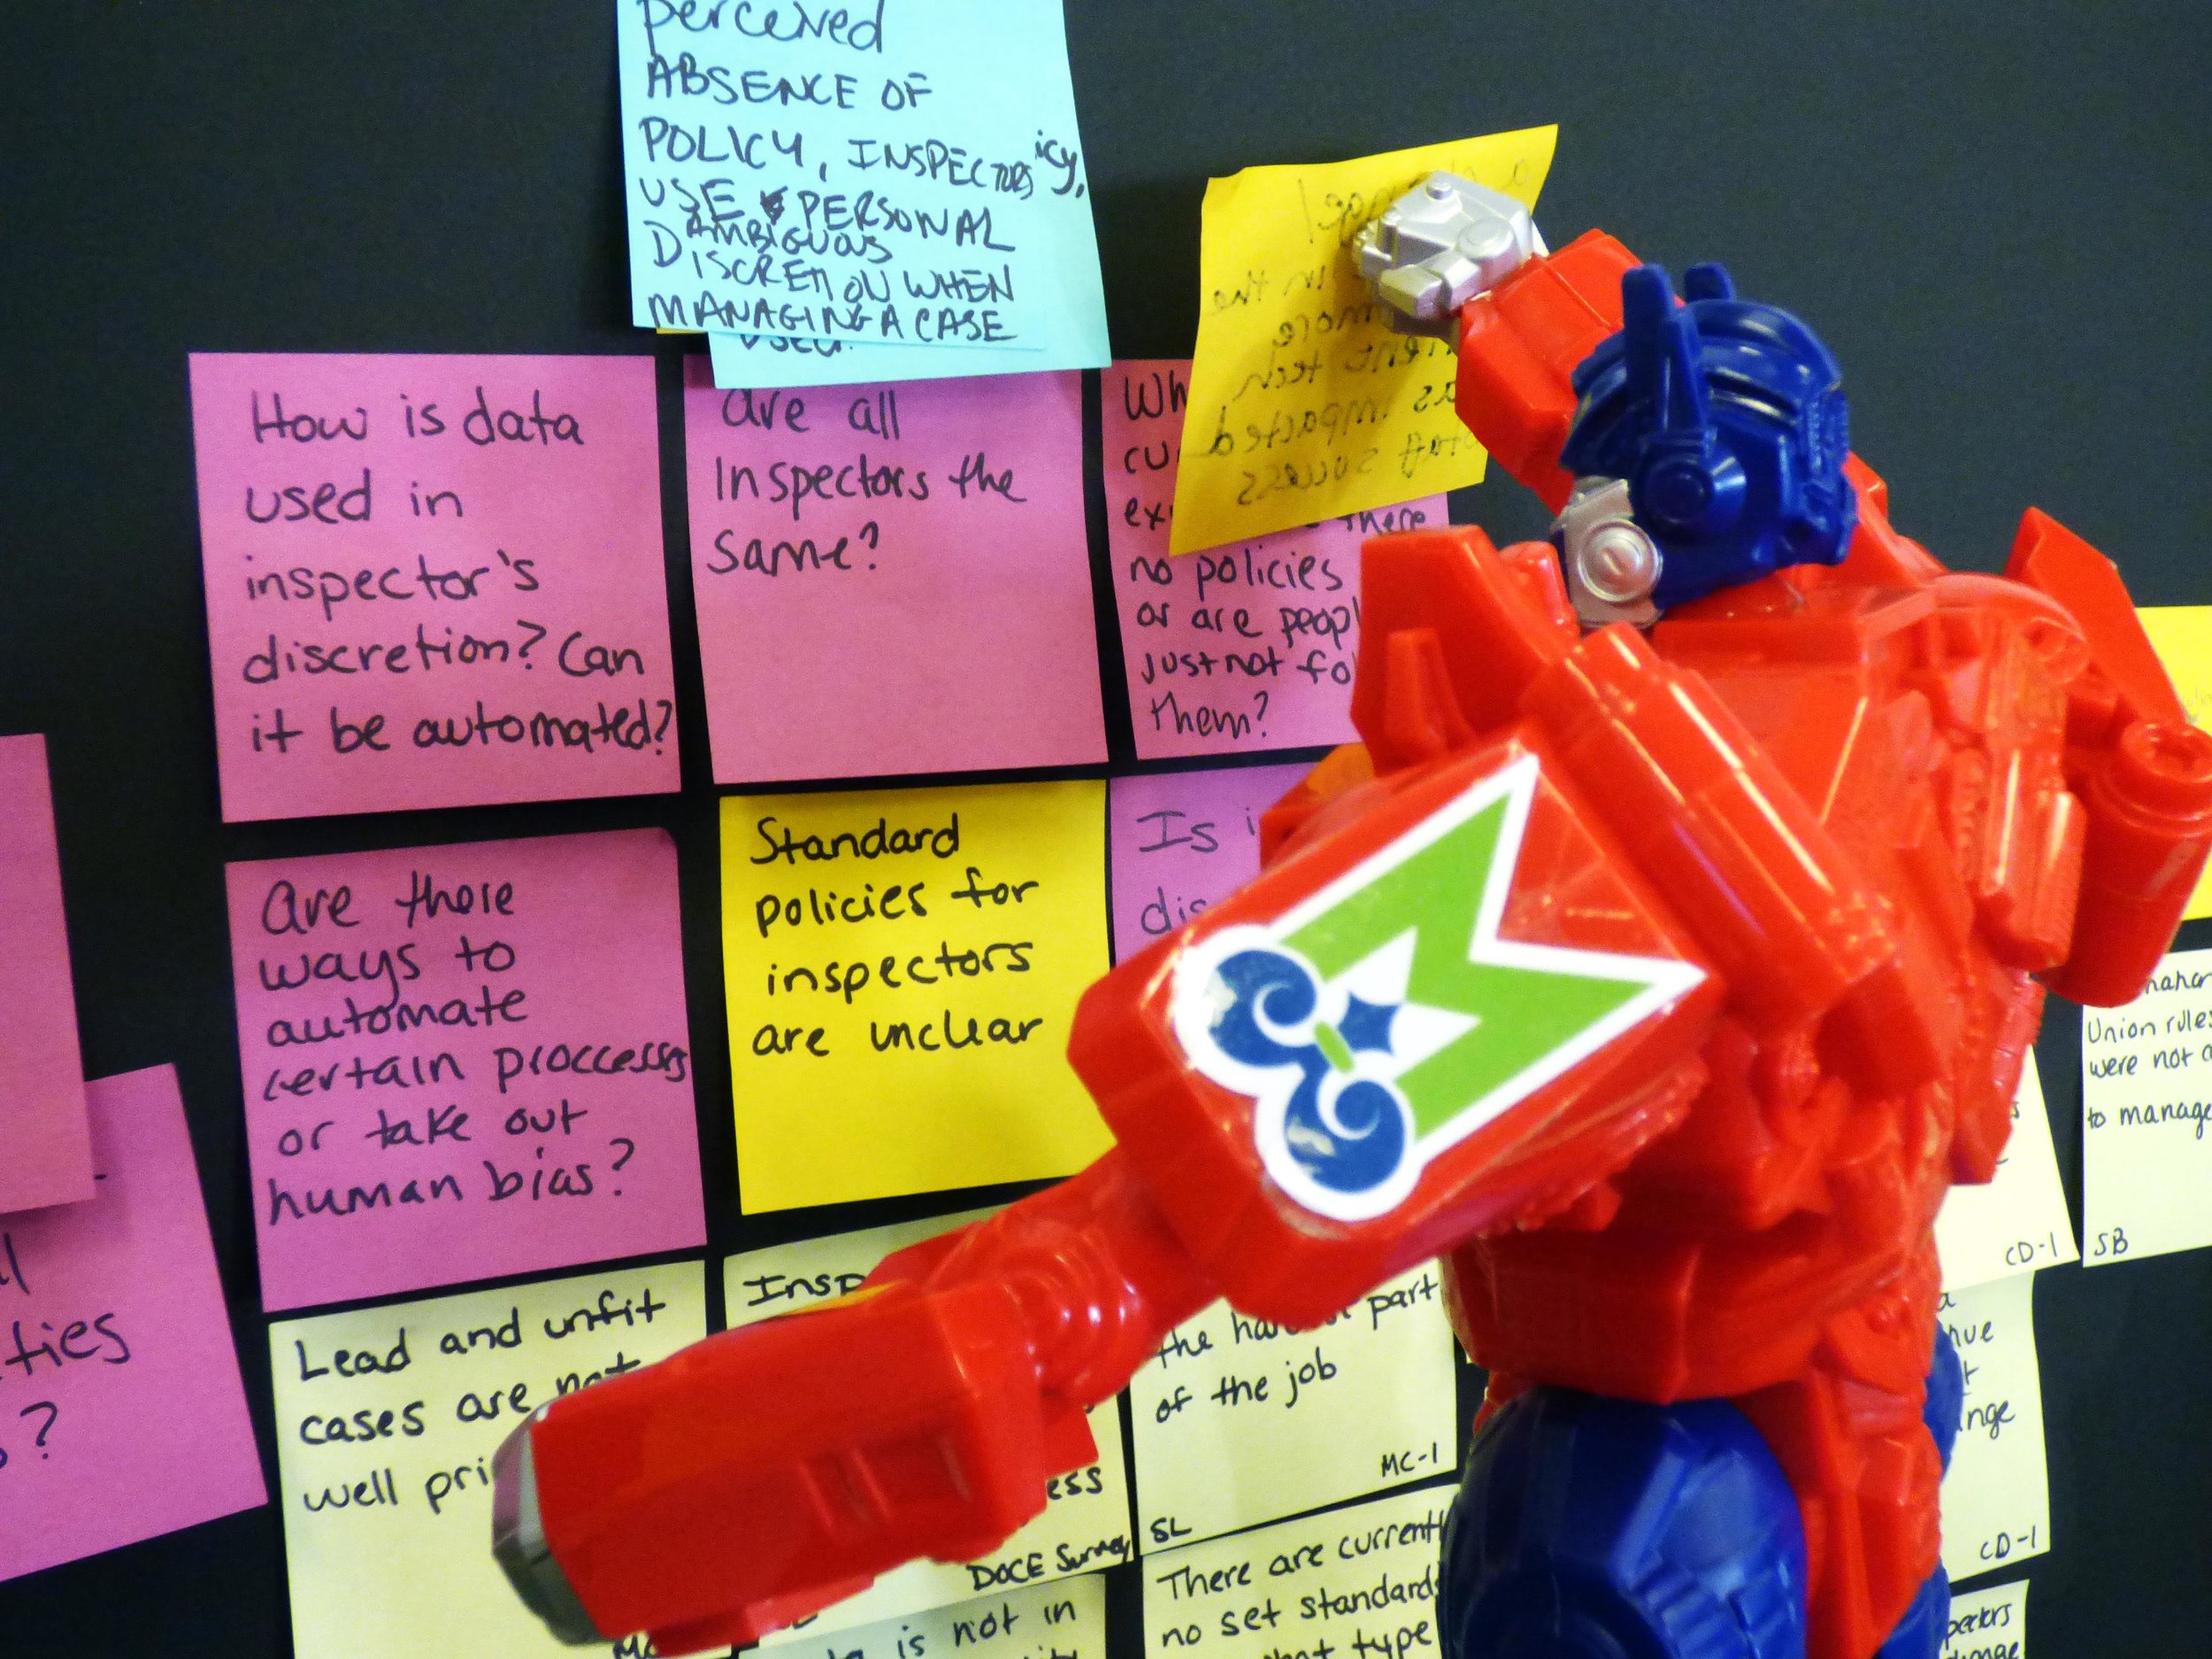
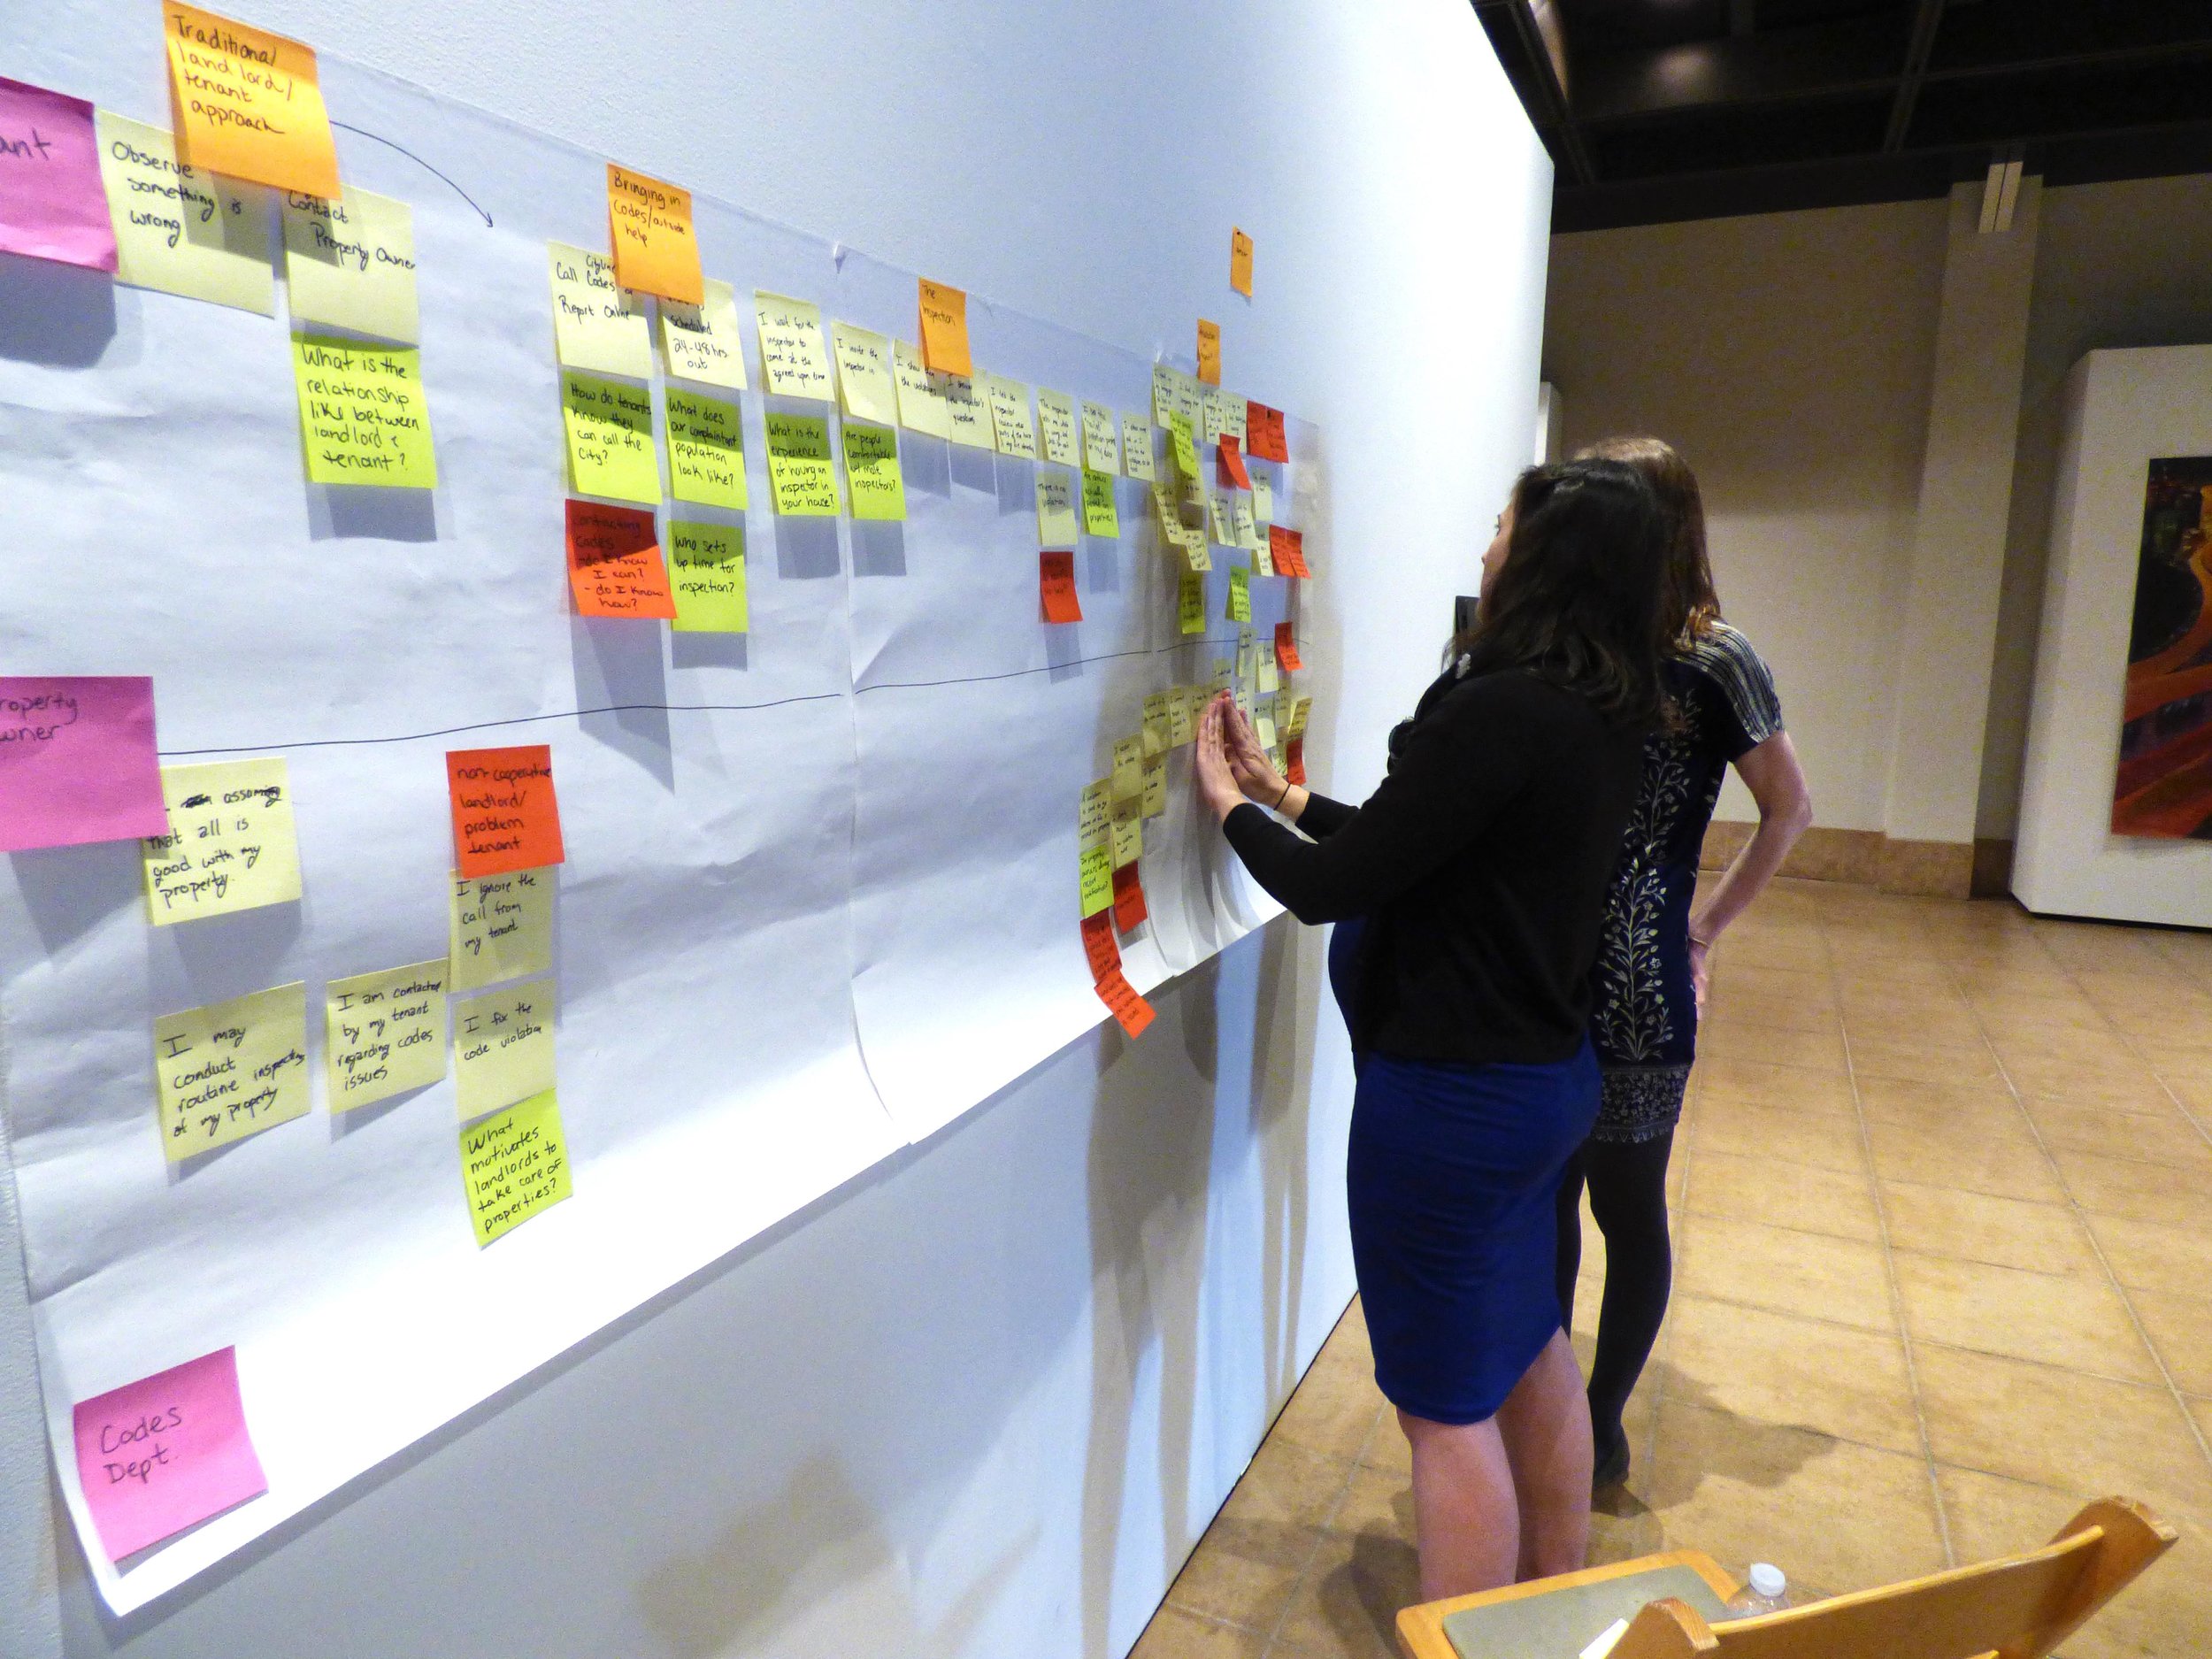
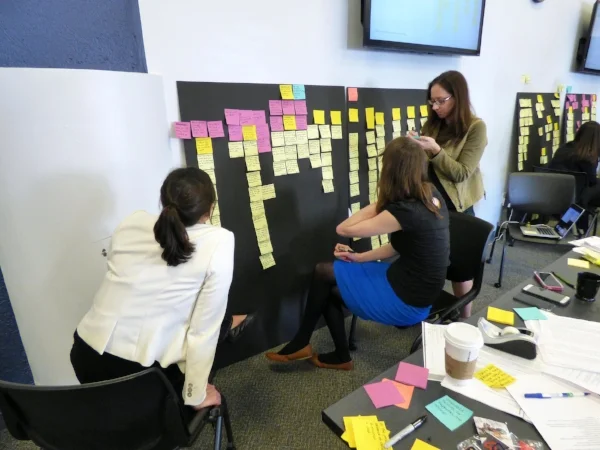
We practiced each method and anticipate using them all over the next several weeks. A team favorite was journey mapping. Journey maps “visualize how a person and a system interact with each other over time.” We designed a journey map which showed how tenants and landlords move through the code enforcement process. Our journey map is shown in the images below. Each step in the process is identified by a yellow post-it note. The other post-it notes represent questions that need to be answered and "pain points" within the system.

In October 2016, Adria observed an inspection of a property with code violations. The tenant described a long struggle trying to communicate with their landlord and the stress involved in finding safe and affordable housing. They explained that having to move to alternative housing affected their ability to concentrate on work, school, and family. We used this person’s experience to inform our mapping, and placed post-its along the tenant’s timeline explaining different steps in their code violation journey.

In January 2017, our team met with a group of landlords. The landlords described their frustrations communicating with the City and with their tenants. They described how they often feel “demonized” and blamed for the city’s greatest challenges and that at the end of the day they are businessmen and women. Again, we took post-it notes and charted the code violation journey that landlords experience.
Disclaimer: each of these timelines represent a point of view, with biases and motives. However, each of these timelines show the true frustrations and behaviors of key stakeholders as they work through a key City process. The mapping tool allowed us to understand where in the code violation process we can influence behavior that will result in real impact. We still have a lot more work and research to do, but our first journey map revealed gaps in communication between the City and tenants, between the City and landlords, between landlords and tenants, and between tenants and the housing market. There is potential in each of these gaps to make a positive difference.
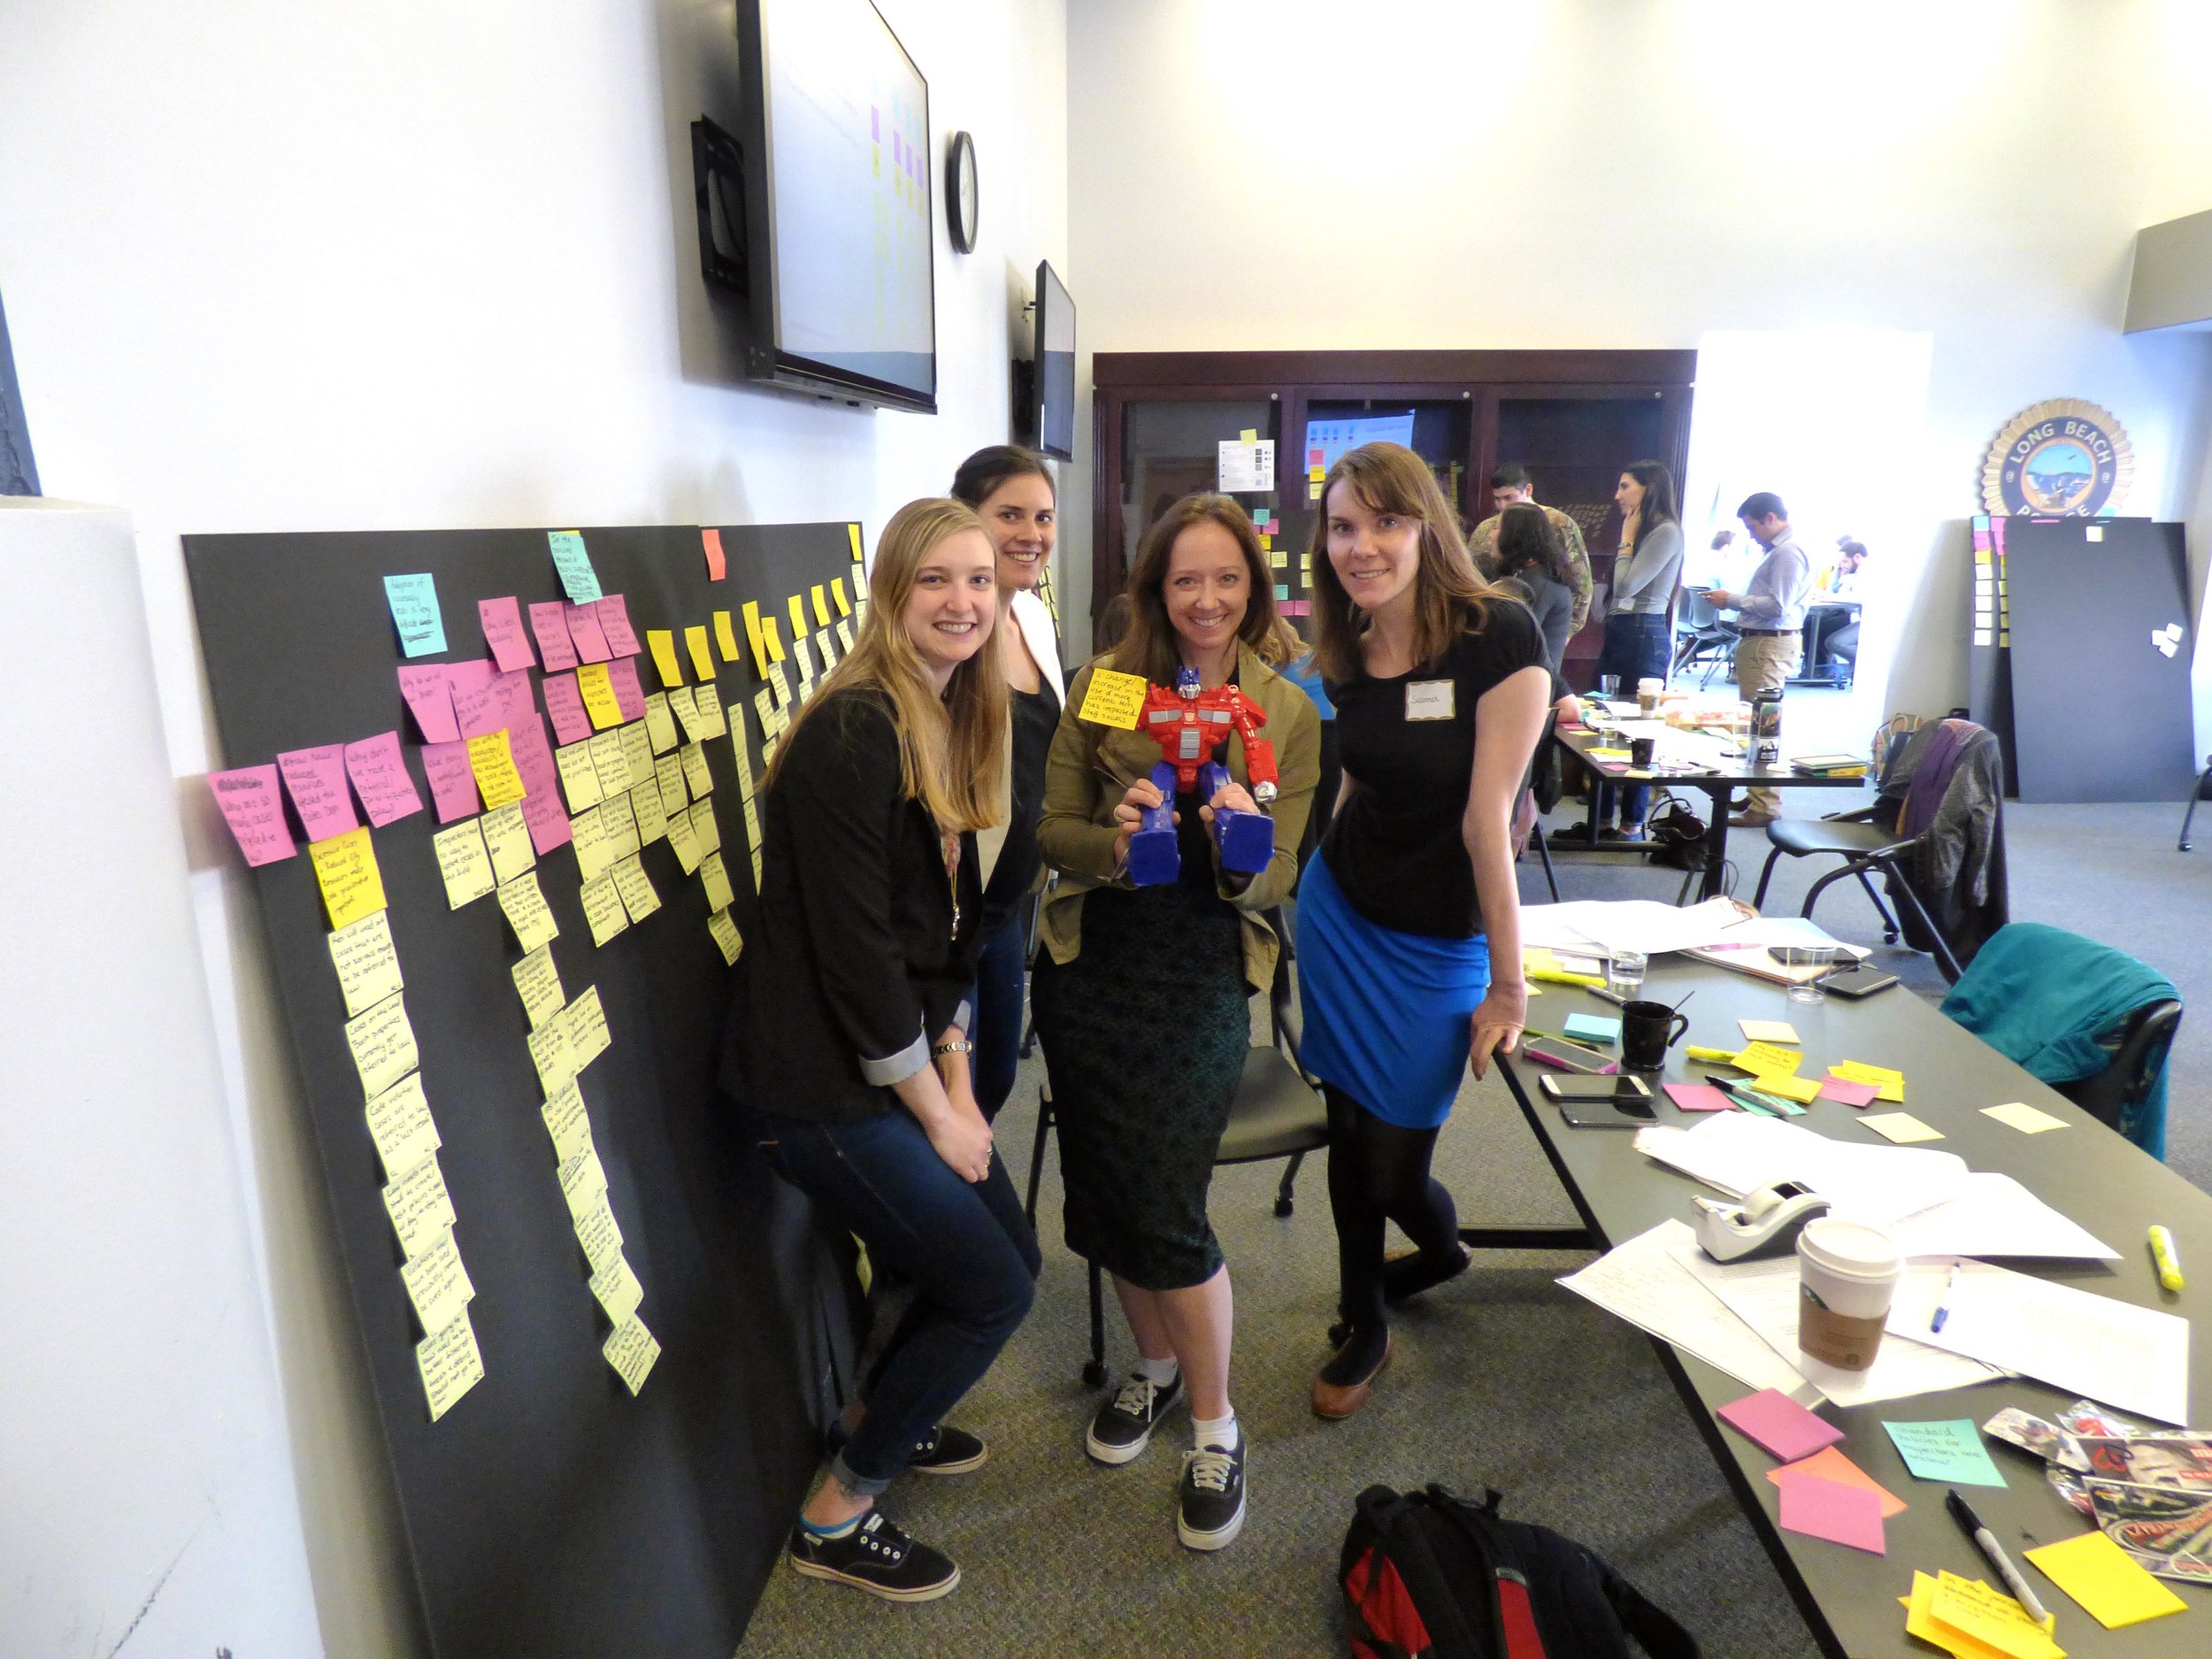
Before heading back to snowy Syracuse, we accepted the i-team Transformer Award. Every month, Bloomberg selects an i-team that best exhibits a dedication to transformative change and we were truly honored to be selected for the month of February. We will continue to advance our work here in Syracuse with the new Design-Based Innovation skills that we obtained during this training, and I’m thrilled by our team’s potential to use this information to truly transform Syracuse moving forward.